

Logistics
Chapter 6
The logistics segment has matured considerably as an asset class amongst investors in recent years. Ever increasing e-commerce sales, the freight crisis, geopolitical tensions and increased risk in the global value chains help further underpin the segment’s attractiveness.
European logistics and industrial property as a proportion of total transaction volumes has risen from around 10 percent to 20 percent in the past decade, according to figures from JLL. The same trend can be observed in Norway. Domestic and international figures both show an abundance of capital in search of logistics property, and transactions worth NOK 3.8 billion have been recorded in Q1 this year in the logistics segment. This is slightly higher than in the same period last year.
Transaction volumes (billion) YTD 2022 / 2021
0
0
.
0
0
.
As a result of increased risk in global value chains, many logistics companies have changed their warehousing strategies in an attempt to mitigate the consequences of product shortages and delivery delays. Many firms are now seeking to stock greater volumes of raw materials throughout the value chain and store more of their finished goods closer to the end users. One direct consequence of this risk aversion is a growing need and demand for warehousing space. More information about the freight crisis and its impact on logistics property can be found in the February edition of our monthly analysis product “Innsyn & Utsyn”.

There is a high level of activity in the rental market along with high demand for the most central and attractive logistics hubs in the Oslo region. These hubs have very low vacancy rates and have seen a considerable rise in rents in recent times, with rents topping out at NOK 1,400 for large warehouses (>10,000 sq. m.) in the most sought-after areas. Smaller premises nearer the city centre can achieve even higher rents. The emergence of last-mile logistics in the larger cities has done much to push up rents in strategic locations, and in some parts in eastern Oslo we are witnessing higher warehouse rents than office rents. We expect the positive logistics trend to continue, thus pushing up rents even further.
50
0
.0%
Prime yield
1,
Prime rent, NOK
NB: In Norwegian.
NB: In Norwegian.
Rental price range in various logistics areas. Click on the areas to see the rental price range (NOK / m2)
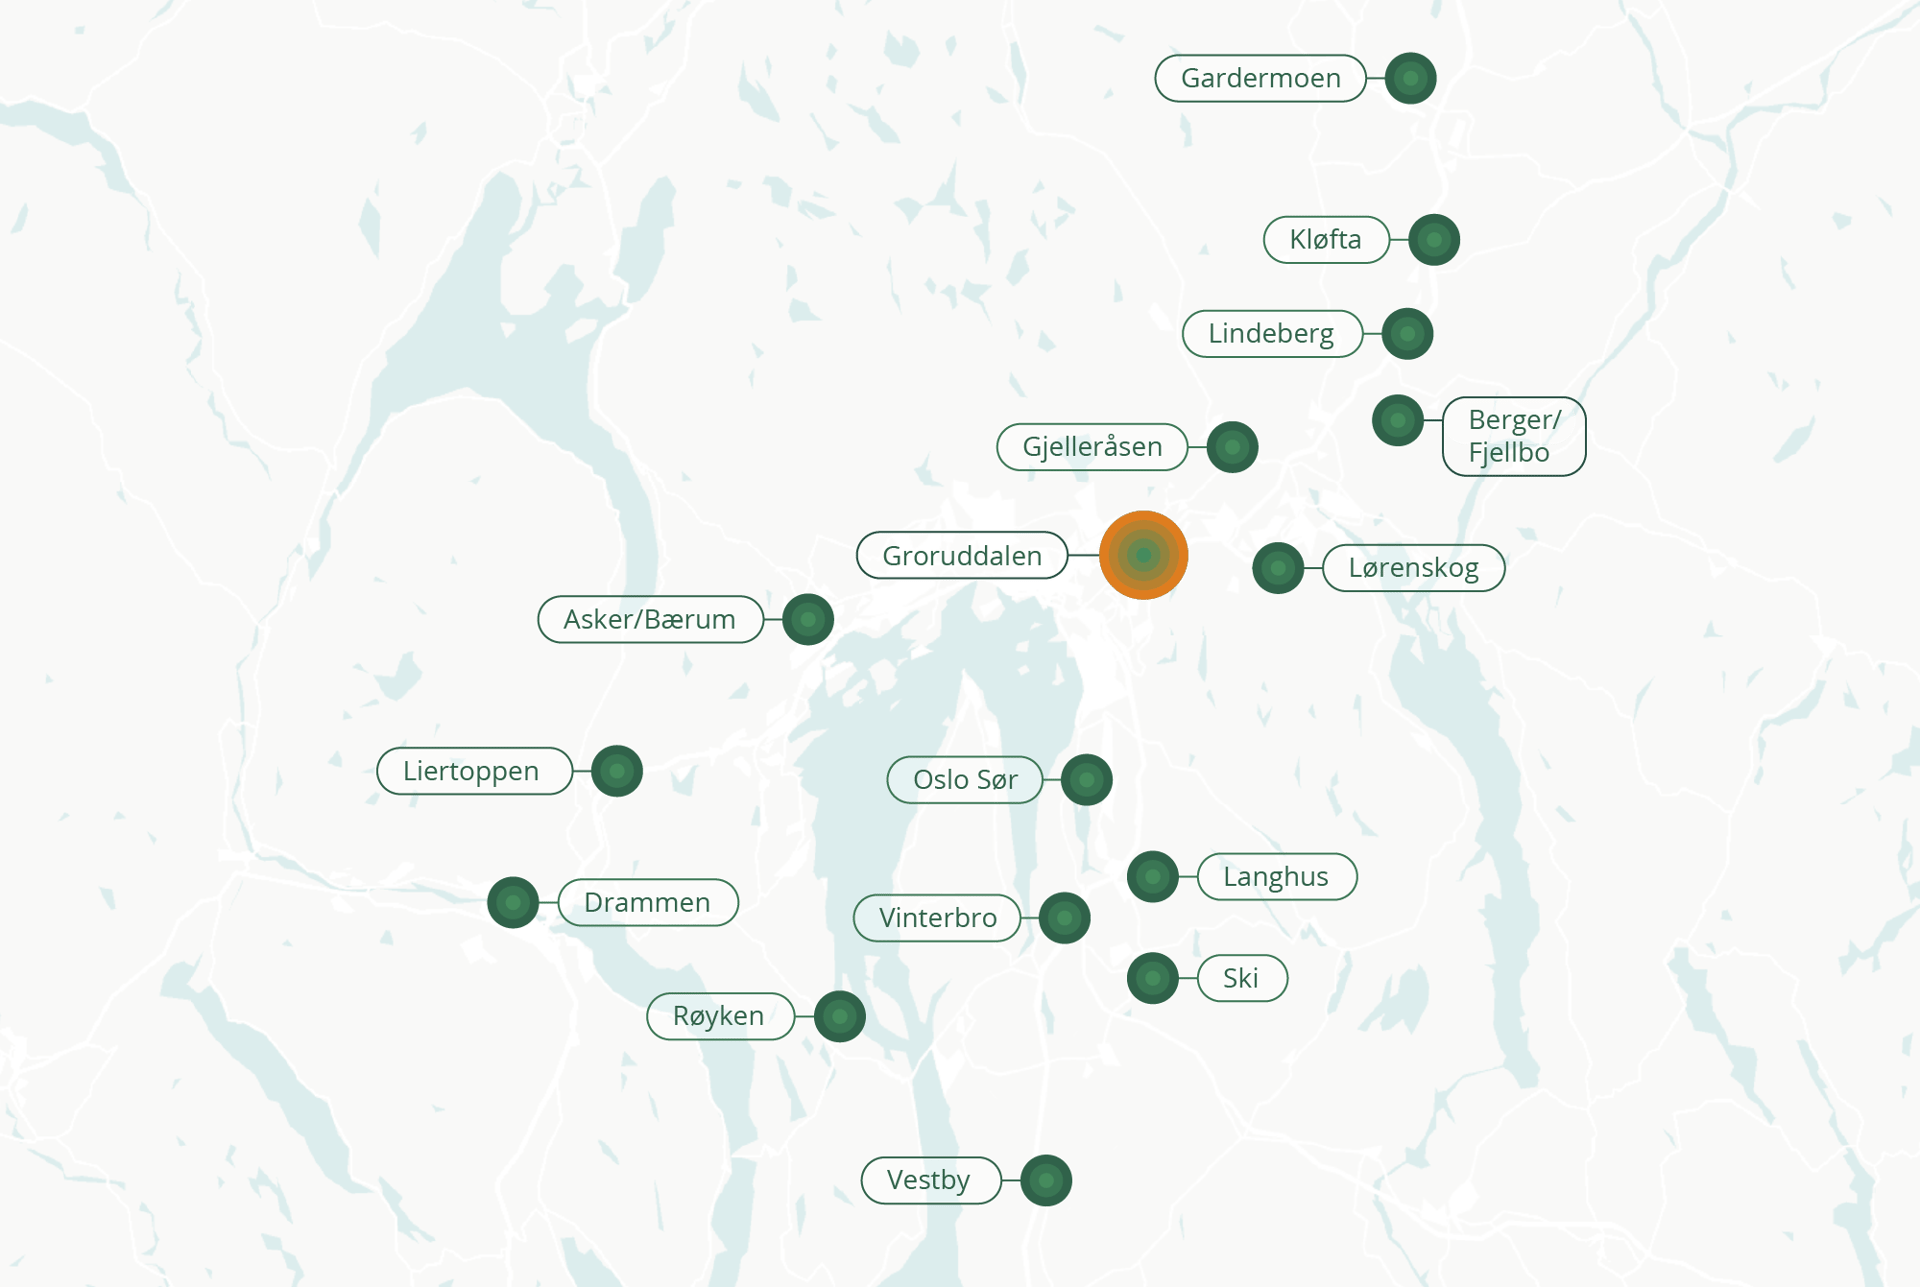
Groruddalen
1500 – 2000
Gardermoen
900 – 1100
Gjelleråsen
1000 – 1300
Asker/Bærum
900 – 1300
Liertoppen
1000 – 1400
Vestby
750 - 950
Drammen
800 – 1250
Berger/Fjellbo
1200 – 1400
Lørenskog
1200 – 1400
Oslo Sør
1200 – 1400
Kløfta
1100 – 1300
Vinterbro
1100 - 1300
Langhus
1200 – 1400
Lindeberg
1000 – 1200
Ski
1100 – 1300
Røyken
700 – 950
Leiepris-intervall i ulike logistikkområder. Totalt logistikkareal er ~5,3 millioner m2.
1400 – 1700

1200 – 1400

700 – 1300

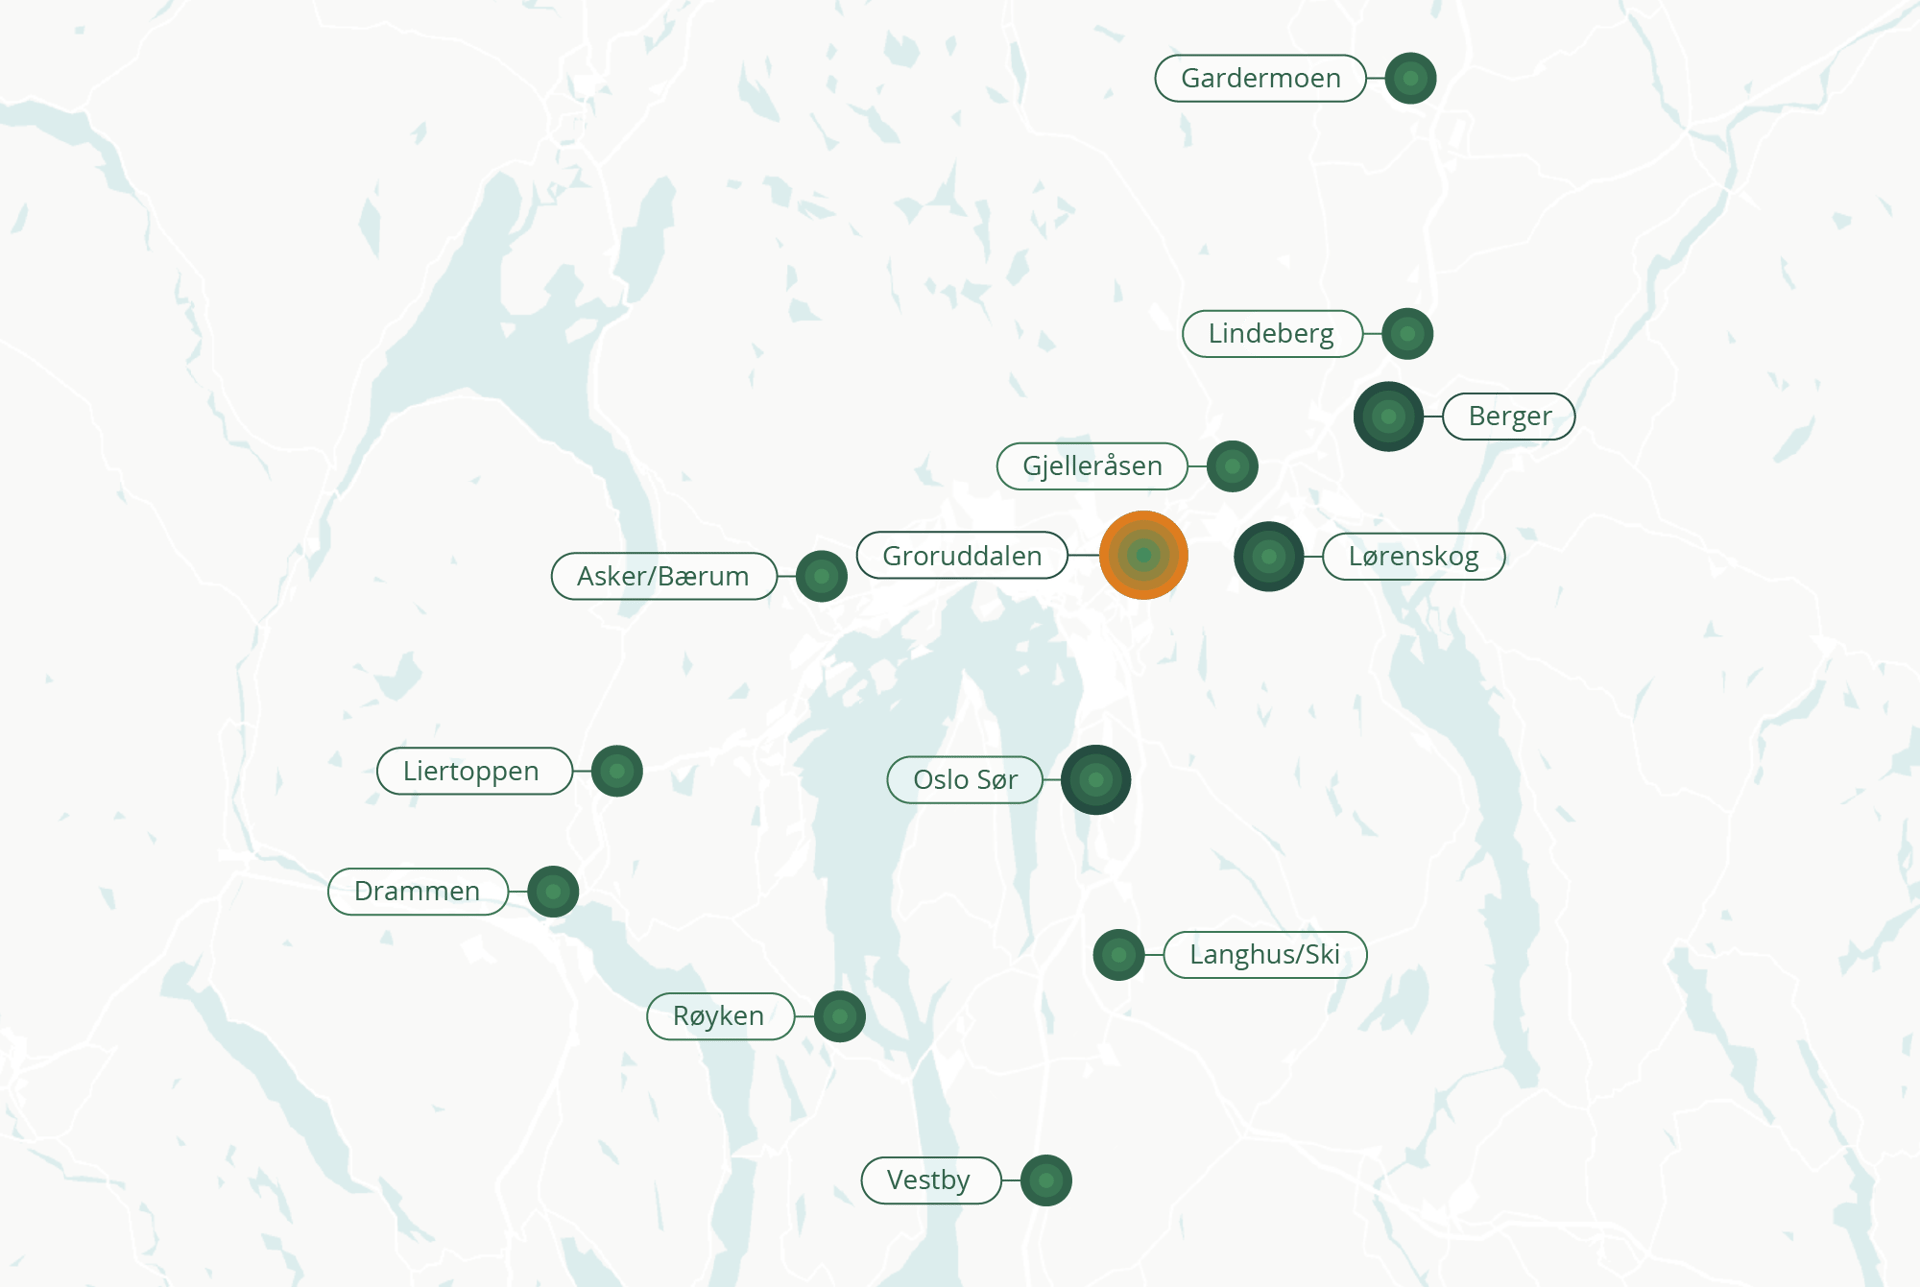
Groruddalen
1400 – 1700
Lindeberg
1000 – 1200
Gardermoen
800 – 1050
Gjelleråsen
1000 – 1300
Asker/Bærum
900 – 1300
Liertoppen
900 – 1200
Vestby
700 – 950
Røyken
700 – 950
Langhus/Ski
900 – 1350
Drammen
800 – 1250
Berger
1200 – 1400
Lørenskog
1200 – 1400
Oslo Sør
1200 – 1400
NB: In Norwegian.
Prime leie, NOK
Prime yield, prosent
1200
0
,0
Logistics prime yield, percent
Proportion of total transaction volume, percent
Andel logistikktransaksjoner av det totale transaksjonsvolumet – andel 2022 kommer
[Chart title]