

Hotel
Chapter 8
In the past two years the hotel property market has been troubled by uncertainty and limited travel activity. The transaction market dried up in 2020, but demand recovered considerably in early summer last year. Occupancy rates have fluctuated in sync with restrictions. Room rates hit rock bottom at the end of 2020 and have since experienced a rising trend.
Average occupancy rate 2018-2019
The transaction market for hotel property dried up at the start of 2020, when the pandemic struck with full force and society shut down. Uncertainty about how long the pandemic would last and when travel activity would pick up meant investors were reluctant to invest in the hotel market. As a result, we only recorded two hotel transactions in 2020.
Moving into spring in 2021, however, we noted that optimism in the market was returning, with a number of transactions completed before the summer. New lockdowns late last year and renewed uncertainty around the omicron variant meant that activity levels fell at the end of the year. Despite this, we recorded 16 transactions last year, the second highest number ever recorded.
Transaction market
0
~
%
Average occupancy rate 2020-2021
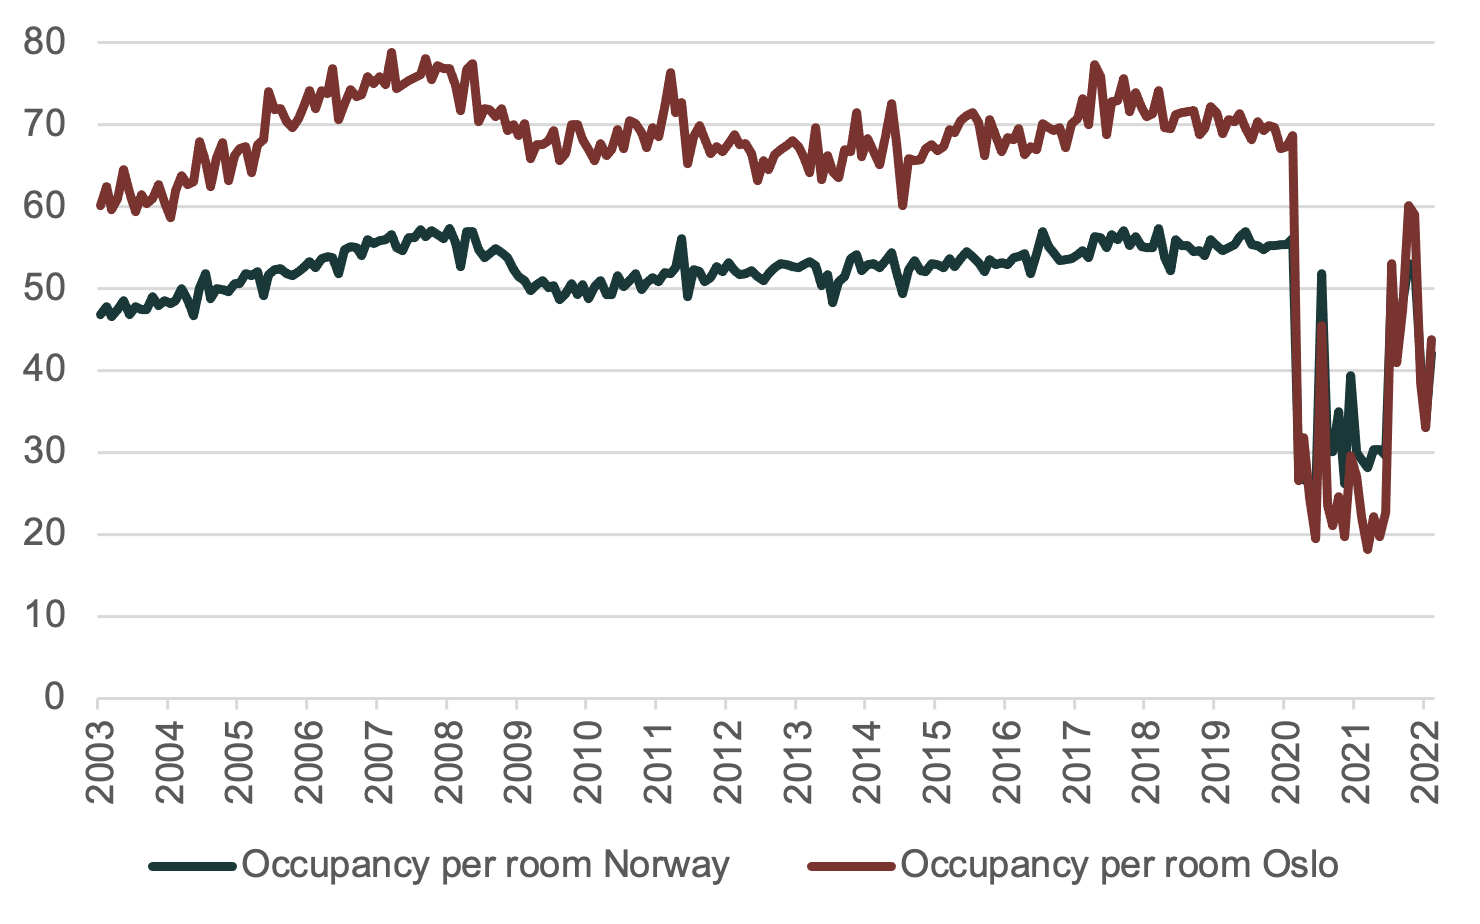
Exceptionally low travel activity since the Covid outbreak has severely affected hotel occupancy and room rates. As a result of the March 2020 lockdown, occupancy rates in Norwegian hotels fell from more than 50 percent in February to less than 20 percent in March. Occupancy rates rose sharply as the restrictions were lifted in early summer, albeit to a lower level than normally observed in the summer months. Occupancy rates during the pandemic have fluctuated as new restrictions have been introduced and lifted.
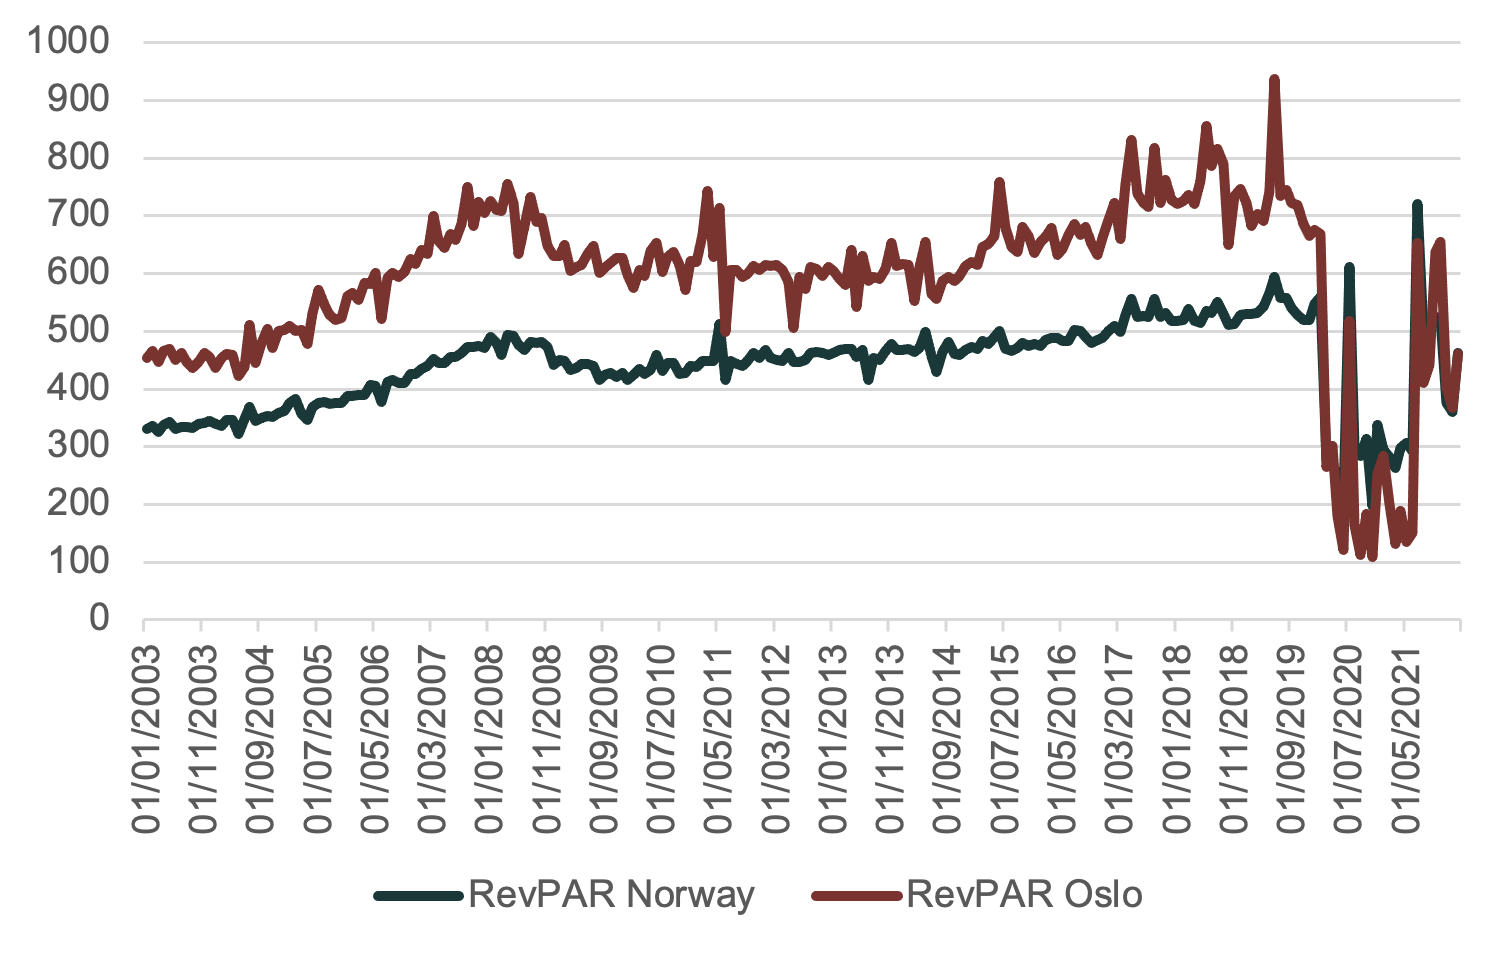
Room rates fell during 2020 and early 2021 before starting to rise last summer. Room rates are now almost back to pre-Covid levels but have fallen somewhat in recent months as a result of the latest restrictions introduced at the end of last year.
Occupancy and room rates
0
~
%
Occupancy per room – Oslo vs. Norway
RevPAR – Oslo vs. Norway
Belegg per rom – Oslo vs. Norge
Inntekt per rom (RevPAR) – Oslo vs. Norge
Belegg per rom – Oslo vs. Norge
Inntekt per rom (RevPAR) – Oslo vs. Norge
Inntekt per rom (RevPAR) – Oslo vs. Norge
Outlook
If we avoid new Covid restrictions, we are of the opinion that investor interest in hotel property will increase, as was observed last year.
Furthermore, we consider that occupancy rates in Norwegian hotels could return to normal levels in early summer if new lockdowns are avoided.